From my last post on October 4, 2023 ~ “On the close today October 3, the SPX has now confirmed a quarterly downtrend, the DJI confirmed the QDT yesterday. Probabilities suggest the SPX should hold above the QSZ 4194/4151, and then resume higher into the YRZ 4714/4870. “ The SPX continued to test the QSZ into the later part of October and has been in a continuous monthly uptrend ever since.
The SPX is now nearing the upper range of the 2024 Yearly Pivot resistance zone 4952/5070 and the Five Year pivot resistance 1.618 Pivot at 5111. This is where I suspect the SPX gives some relief with a consolidation and monthly downtrend before the uptrend continues. The technical (pivot zone) characteristics coming out of the 2016 Bear and the beginning of 2017 are very similar.
The weekly chart below displays the Yearly and Five Year pivot zones. I have traded these same pivot patterns on the 15 minute charts for years before I stepped outside of the day traders box. Good Luck and Trade Safe.
In my last post in early June the SPX was just breaking out of the second quarter QRZ 4233/4280 with a continuation of the quarterly uptrend. The uptrend continued higher through the end of July, testing and failing at the third quarter QRZ 4524/4572.
With the failure at quarterly resistance the SPX ended the monthly uptrend from the March low (5 monthly trends up from the October 2022 low) with a confirmed monthly downtrend in August and a test and bounce near the QP 4319. The SPX made a significant rally into the end of August, but failed once again at the QRZ on the first of September, where it dropped back below the QP to end the month/quarter.
On the close today October 3, the SPX has now confirmed a quarterly downtrend, the DJI confirmed the QDT yesterday. Probabilities suggest the SPX should hold above the QSZ 4194/4151, and then resume higher into the YRZ 4714/4870. Good Luck & Trade Safe!
Sorry for the long absence, I couldn’t justify writing another update until the Quarterly uptrend reconfirmed back above the February 1st QUT confirmation, and a close above the first quarter daily closing high at 4180. That reconfirmation came on May 18. Then on Friday June 2nd the SPX had its first close above a QRZ since the fourth quarter of 2021. In my speculation the Bull Market began on February 1st with the quarterly uptrend in place. Everything since then has been Noise!
This brings us to the Yearly Pivot Zone swing theory, which I believe has been in play since the October 2022 low. The Bear market reversed just below the 2022 YSZ and closed the year holding above that pivot zone in December. The SPX retested the December 2022 lows in March, also holding above the first quarter pivot. The SPX is now trading above the YP 4050, and should the Yearly Pivot Zone swing theory play out, the SPX should swing from yearly pivot zone support and find resistance at the YRZ 4714/4870 sometime in the second half of this year.
With a break above the QRZ 4233/4280, and we see a successful test of that breakout, the next quarterly resistance is at the QR 4434. Good Luck & Trade Safe!
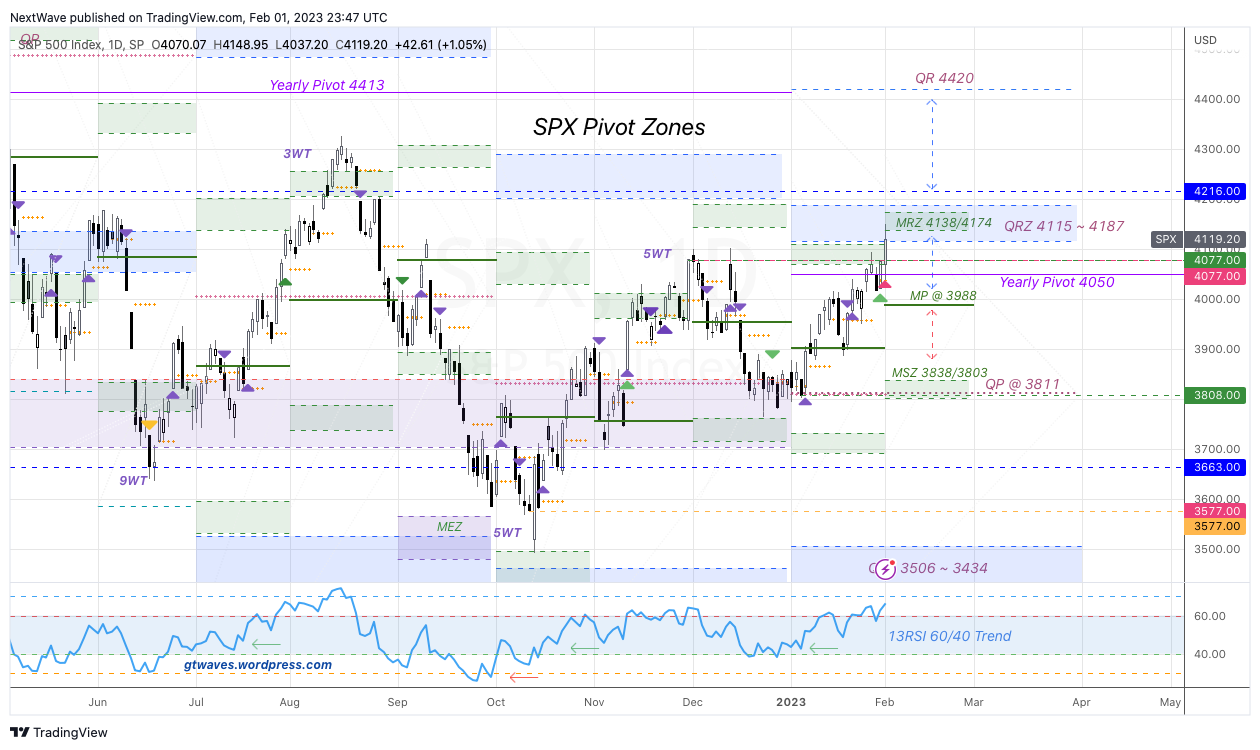
The SPX continued higher to start February confirming a quarterly uptrend, but stalled out on day 2 at the upper quarterly pivot resistance zone QRZ 4115/4187. The SPX remained below the MRZ 4138/4174 the first half of the month before breaking down and fell below the MP, and reversing at time symmetry with the December correction.
The month of March began with a close below the February low close, confirming a monthly downtrend, then reversing with a bullish engulfing candle the very next day. The week ended with a weekly uptrend confirmed and a close above the March pivot 4036. Should the SPX continue higher above 4180, then we’ll have 5 monthly trends up from the October 2022 low. This would also reconfirm the quarterly uptrend and logically begin a new Bull Market.
My expectation for March, the SPX should remain above the MSZ 3910/3880 and continue up into the MRZ 4162/4192 with the potential for a breakout of the monthly/quarterly pivot zone confluence at the QRZ 4115/4187. As always caution of a continued failure at the QRZ, and a failure at the MP would send the SPX back down into the MSZ. Good Luck & Trade Safe!
The SPX opened the year and month of January above the quarterly pivot 3811, and closed the month testing the QRZ 4115/4187, also confirming a quarterly uptrend. We now have our first signal of a new Bull trend. Once we get a breakout of the QRZ, the SPX should make an attempt at testing the YRZ 4714/4870 at some point during the year.
Yes, we do have quite the confluence of M/Q pivot zones as overhead resistance at MRZ 4138/4174 & QRZ 4115/4187. Should the SPX fail at this pivot resistance and fall below the MP 3988, then look for a potential drop into the MSZ 3838/3803 & QP 3811. I would expect price to remain above the QP if the Bull trend is to remain in force. Good Luck & Trade Safe!
At the start of 2022, I was looking for a push higher with a test of yearly pivot zone resistance before any significant correction took place. The SPX had other plans, as it made only one daily closing higher high on 1/3, and a higher high that closed lower on 1/4, then dropped the rest of the year. Before January was over the SPX had already broke through the Yearly Pivot and was testing quarterly support, which was the first clue that Yearly support would probably be tested at some point during the year. The SPX spent most of the year below the YP and the last three quarters testing the Yearly Support Zone. The SPX ended the 2022 year down -19.43%, and a high to low drawdown of -27.54%.
With the 2022 year behind us, what can we expect going forward? Let’s start by looking at the bigger picture and the 5 year pivot zones on the SPX Yearly Pivot Zone chart below. As the pivot zone theory works on all time frames, I would expect them to do the same on the 5 year time frame, and historically they do. The zones are tested with a breakout or a failure. As you can see the 5 year resistance zone was tested/breakout in 2020, pushed up and tested/failed at the 5 year exhaustion zone in 2021. The SPX has now retested the 5Y PRZ again in 2022, which is essentially a retest of a five year breakout pattern. This is no different than a daily/weekly/monthly or yearly pivot zone breakout, only on a much larger time frame. Breakouts that consolidate at or above the pivot zone usually continue in the direction of the original trend breakout.
The 2023 SPX yearly and quarterly pivot zones should prove to be key throughout this year. Looking at the daily chart below the SPX is developing a basing pattern above the QSZ 3506/3434 and below the QRZ 4115/4187. The Bulls need a strong breakout with a successful test above the QRZ to kick off a new Bull Market. The Bears break below the QSZ and could find the Bulls waiting at the YSZ 3387/3230. Should the SPX break below the YSZ the 5YP 2768 comes into play. My expectation is the SPX remains above the YSZ and works its way to new all time highs over the course of the year.
All trends at the beginning of 2022 were up, and to start 2023 they are all down, from yearly to weekly. The SPX closed the year with an inside month downtrend holding above the December MSZ, a potentially bullish trend reversal pattern that could push up into the January MRZ 4070/4110. The SPX should start the year above the January MSZ 3733/3693 and below the MP 3901. A drop below the MSZ to start the year would take the SPX down to the QSZ 3506/3434. My expectation on the shorter term is for the MSZ to hold and look for a test of the MRZ/QRZ. Let’s see how this plays in the next couple weeks as the new years gets underway. Good Luck & Trade Safe!
Happy New Year!!
SPX ~ Pivot Zones
SPX ~ Yearly Pivot Zones
“New beginnings are often disguised as painful endings.” – Lao Tsu –
A short pre-Christmas update, with a potential bullish Pivot Pattern to end the 2022 Bear Market!
The Bears are salivating for a break of the October lows and looking for a repeat of the 2008 analog! I’m not that pessimistic quite yet. The Red arrow on this monthly chart shows the point in the analog that many are talking about. At that point the 13/34ema had already crossed. Look at where it’s at today. SPX chart.
The Bullish set up…. The SPX has 5 weekly trends up and a monthly uptrend confirmed from the October low to the November high. The DJI has the first confirmed quarterly uptrend. I was expecting a QUT in the SPX by this time but we may not get that surprise until January. Going into today 12/22, the SPX has three weekly trends down into a monthly/weekly pivot support confluence. Should this support zone hold, the Bullish case is a rise into the first quarter of 2023. A quarterly uptrend should confirm in January above the November closing high 4080. Then 2023 could be a very good year, with the typical start to a new bull market bumps along the way. For now, look for the pivot zone confluence to hold support, otherwise the Bears will continue to take this down to retest the October lows. Good Luck & Trade Safe!
In October the SPX confirmed five weekly trends down from the August 16 high to the October 13 low. With the fifth WDT confirmed the SPX held and reversed above the October MSZ 3496/3432 and pushed back above the QP 3832 and closed out October near the high at 3872. The rally up from the October 13 low confirmed a weekly uptrend and this first week of November confirmed a weekly downtrend. Interestingly this brings the SPX to an inflection point going into the week of the midterm election. Who would have guessed that was going to happen!
If the plan that I laid out in October goes as expected, the SPX should continue higher in November pushing into resistance at the QRZ 4202/4290. Look for shorter term resistance at the November MRZ 3963/4012. A failure at the MRZ would suggest an end to my expected push into the QRZ. It may be quite volatile in the coming weeks, please trade safe! Good Luck!
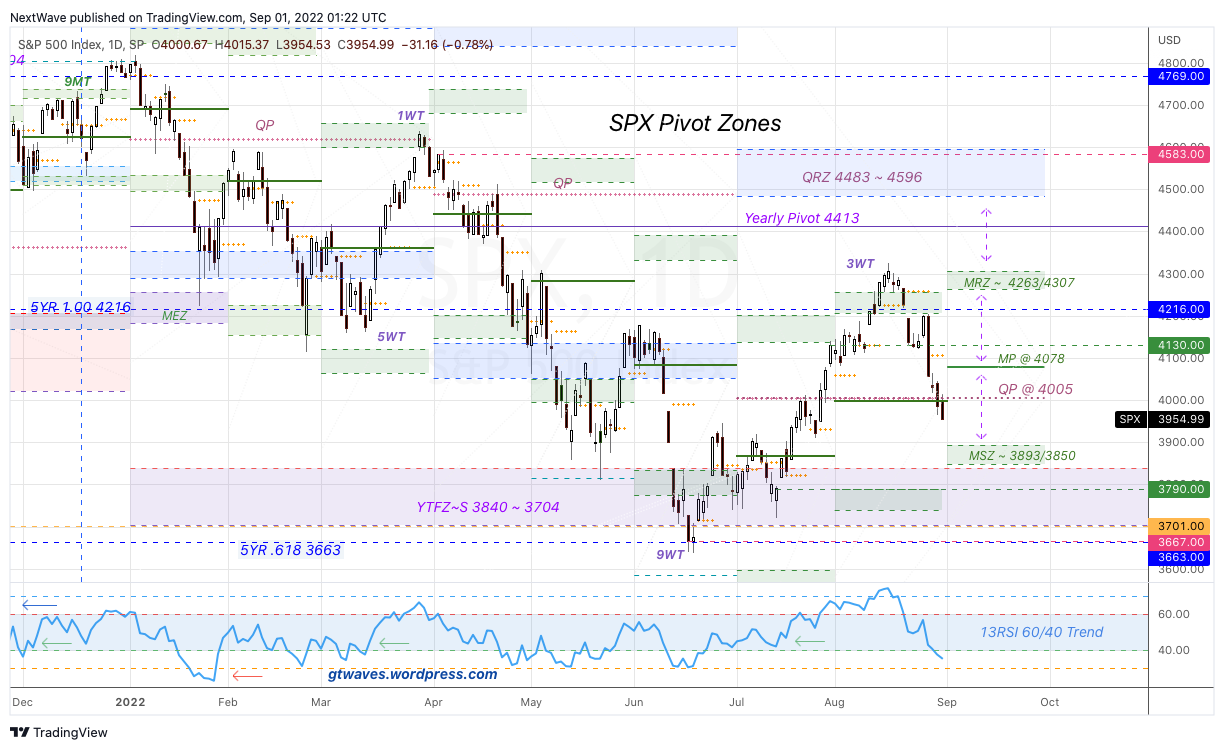
The SPX began the month of September testing the MSZ 3893/3850 with a monthly downtrend confirmation. The hold of MS lead to a strong four day rally with a single day close above the MP 4078, this confirmed a weekly uptrend. This gave the Bulls hope for a potential monthly pivot swing pattern. But then the very next day the SPX gapped down confirming a weekly downtrend two days later. The trend continued lower through the MSZ and nearly down to the monthly pivot exhaustion zone to close the month pennies from the low.
Going into the final quarter of the year, so far this yearly downtrend structure has one quarterly trend down (with three consecutive lower closing quarters) and 5 monthly trends down from the January 4 high to the September 30 low. The fifth monthly downtrend so far has three weekly trends from the August high to the September low. This last week confirmed a weekly uptrend, and just like so many WUT’s during this Bear stalled the next day and reversed by the end of the week.
Looking at two scenarios at this point. Favored first, the SPX closes below last weeks low close at 3640, confirming a weekly DT and holds above weekly support and the September low. Second, should the SPX WUT fail and close below the September 30 low close at 3586, then the monthly DT will have five weekly trends down, dropping into the MSZ 3496/3432 and the QSZ 3461/3374, which should hold. Both scenarios would then be expected to reverse and rally into the MRZ 4031/4094, and potentially into the QRZ 4202/4290.
The first scenario gives some hope to the Bulls to expect a potential quarterly uptrend into the QRZ. The second scenario only re-confirms that the M/Q/Y downtrend may continue after the next monthly or quarterly uptrend is confirmed.
Remember, the Pivot Zones will contain price until an attempted test/fail of a breakout succeeds. Looking at the daily chart below, the Quarterly Zones are now most prominent in constricting price expansion. The SPX made a valiant attempt at reaching towards the September QRZ, but failed and swung back down nearly testing the QSZ. Can the SPX push back up again and test the QRZ by the November elections. That’s my guess! Let’s see what the quarter has in store for us. Good Luck & Trade Safe!
The SPX pushed higher in August holding above weekly pivot support the first two weeks of the month, while making the first monthly pivot zone breakout attempt since the Bear market began in January. That failed breakout made a valiant attempt to re-take the broken weekly pivot zone support. But, we all know how that turned out. That brings us up to date, with the last day of the month dropping further below the August MP. Futures are down another 30 points as I type, maybe it will reverse here!
The new month will begin with the potential for a monthly downtrend if we get a close below 3955. If the SPX can hold above monthly pivot zone support MSZ @ 3893/3850 with the MDT confirmed, then we may see a strong rally in the coming days pushing back up into the MP @ 4078 and a possible test of the MRZ @ 4263/4307. That is what I’m expecting anyway. Otherwise a failure below the MSZ could be Painful!!!
There are still many hurdles to overcome before this Bear can be confirmed Dead. If the SPX remains above 3667 before the end of the quarter then we’ll have our first sign, a confirmed quarterly uptrend. The next test would be breaking out of the subsequent QRZ. For the time being look for trading opportunities in the September pivot zones. Buy support, sell resistance! Good Luck & Trade Safe!